1The Gap Between Guess and Reality
Ask most people how much they spend on subscriptions each month, and they will guess low. One widely cited survey found that people estimate around $86 a month, while the measured average is actually closer to $219 a month, spread across 8.2 active subscriptions. That is roughly 2.5 times what people expect to see.
A separate survey puts the average lower, at $111 a month (just over $1,300 a year), but shows it climbing fast, up from $90 a month the year before. That same survey found that $21 a month, about $252 a year, goes toward subscriptions people have already stopped using but never got around to cancelling.
The exact number depends on which survey you look at. What does not change is the pattern: real spending is higher than the number in your head, and a chunk of it is going nowhere. The only way to know your own real number is to check it, not guess it. That takes about 5 minutes if you follow the steps below.
One category worth checking closely is AI tools, since AI subscriptions stack up at similar small prices and rarely stand out on a statement.
2Step 1: Pull Your Last 60-90 Days of Statements
Open your bank app and every card you use, then load the last 60-90 days of transaction history. One month is not enough. Some subscriptions bill quarterly or yearly, so a single month can hide them completely.
Set a timer for 5 minutes right now. This whole exercise is meant to be quick, not a weekend project. You are not trying to remember every subscription from memory, you are pulling the actual record.
3Step 2: Search for the Recurring-Payment Keywords
Most banking apps and PDF statements let you search transaction descriptions. Use the search box and try each of these words one at a time:
- "recurring"
- "subscription"
- "renewal"
- "monthly"
- "annual"
Also scan for merchant names you do not immediately recognize. Some subscriptions bill under a parent company name instead of the app or service name, which is exactly how they hide in plain sight.
4Step 3: List Every Subscription You Find
Open a notes app, a spreadsheet, or a plain sheet of paper. For every recurring charge you spot, write down three things: the name, the amount, and the next charge date. Do not skip anything yet, even the small $2-3 charges add up.
Example scenario: your list might end up looking like "Streaming app, $15.49, renews the 12th," "Cloud storage, $2.99, renews the 3rd," "Fitness app, $12.99, renews the 20th." Nothing fancy, just the raw facts.
5Step 4: Total It Up and Compare to the 2026 US Averages
Add up every monthly amount on your list. For anything billed yearly, divide by 12 and add that too. This one number is your real monthly subscription spend.
Now compare it to the averages above: $219 a month across 8.2 services in one survey, or $111 a month in another. See where your number lands, above, below, or right in the middle.
Before you added it up, what did you guess your total would be? On average, people guess about $86 a month, less than half of the actual $219 a month figure.
Most people are surprised by the gap between their guess and their real total. That surprise is the whole point of this exercise, it is what turns a vague sense of "I should probably cut back" into an actual number you can act on.
6Step 5: Mark Each One Keep, Cancel, or Downgrade
Go back through your list one more time and mark each subscription with one word:
Keep
You use it regularly and it is worth the cost. No action needed.
Downgrade
You use it, but you are paying for a tier or plan you do not need. Look for a cheaper plan with the same core features.
Cancel
You have not opened or used it in 30 days or more, or it duplicates something else on your list. This is where the money in the $21-a-month "unused subscriptions" figure usually lives, and often overlaps with subscription creep.
That is the entire audit. Five steps, one number, one decision per subscription.
7How Spending Compares by Generation
Subscription spending is not even across age groups. Younger generations tend to carry more active subscriptions and spend more on them each month:
| Group | Average Monthly Spend |
|---|---|
| Gen Z | $377 |
| Millennials | $276 |
| National average (all ages) | $219 |
These figures come from separate surveys, so treat them as a general picture rather than an exact side-by-side comparison. Still, the direction is clear: if you are younger, there is a good chance your real number is on the higher end.
8What to Do With What You Found
A one-time audit tells you where you stand today, but subscriptions do not stay still. New sign-ups, price increases, and forgotten trials mean your real number changes every few months, even if you never open a new app. Running this same 5-minute check once a quarter keeps the gap between your guess and your reality from opening back up.
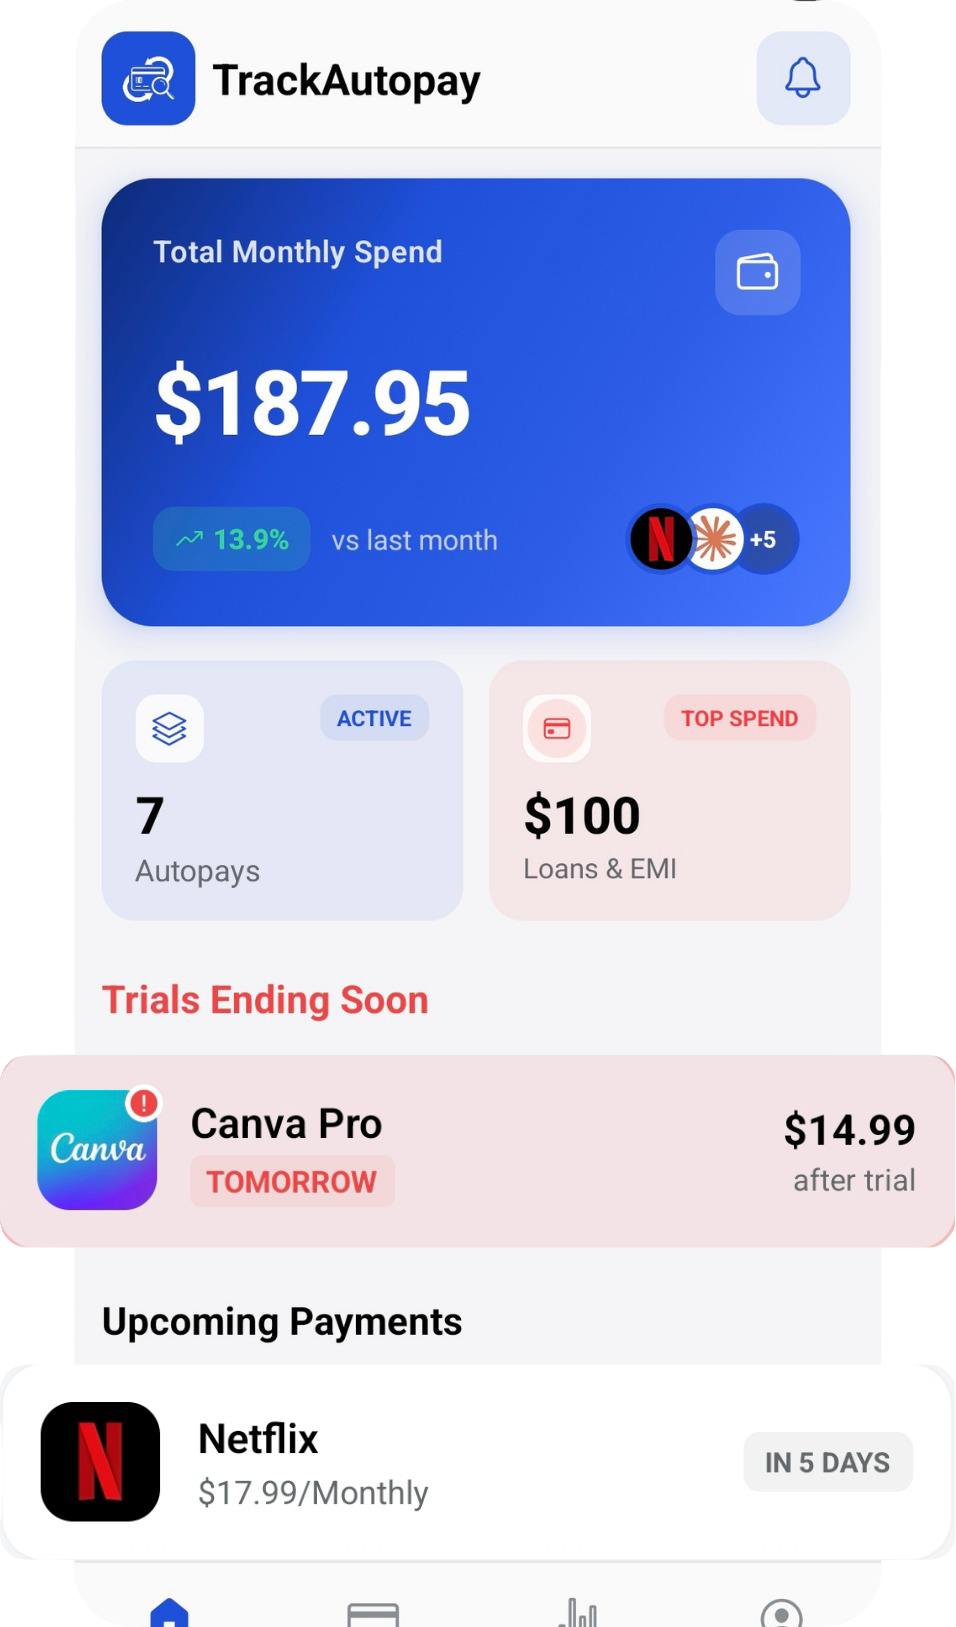
TrackAutoPay gives you a single dashboard for every recurring payment you have listed, so the next audit takes seconds instead of 5 minutes, you already have the list.
Turn Your Audit Into an Ongoing Habit
Save your list once in TrackAutoPay and get a reminder before every renewal, no more re-doing the audit from scratch.